Why Harmonic Patterns?
Harmonic patterns are one of a few tools that try to predict the future behavior of the price. They are based on the Fibonacci numbers and
Fibonacci retracement levels
that, on their own, are one of the fundamental tools of technical analysis. Harmonic patterns can help you better plan the buy/sell moments by identifying the possible turning points.
Check out our "What Are Harmonic Patterns?" article to learn more about them.
High success rate
According to different sources, harmonic patterns have over 80% success rate. That's a lot for a technique that tries to predict the future price!
Math-based
All that a harmonic pattern does is to calculate the differences between adjacent high/low points. If this ratio meets specific requirements, we have a harmonic pattern!
Easy to use
Since they are based on simple rules, they are easy to follow. When you identify a pattern, you buy/sell, set a stop loss, and wait until the price reaches the take profit levels.
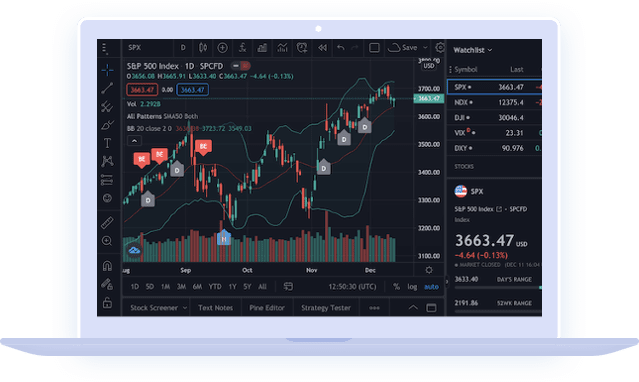
TradingView scanners and indicators
TradingView is one of the best technical analysis platforms. It's browser-based (you can use it on any computer without installing any software), it has every kind of security you might need (stocks, commodities, forex, cryptocurrency), and it's actively developed with new features landing every week or two. It's also a social network for traders to publish their ideas, discuss them, and get inspiration from others. With plenty of drawing tools, aggregation of news and financial data, watchlists, and alerts, it's a preferred charting tool for thousands of traders (including us).
That's why all our tools and trading ideas revolve around this platform.
Don't waste time manually drawing patterns!
Searching for harmonic patterns on the charts takes time. Even with the drawing tools, you still have to draw the XABCD formation and compare the retracement levels for each pattern. After months of practice, you will probably develop a gut feeling where a pattern might appear.
But why waste time when you can automate this process? With our scripts, the whole process of searching and drawing a harmonic pattern happens automatically in a matter of seconds. Just add an indicator to the chart, and whenever there is a harmonic pattern, our scripts will draw for you.
What makes our indicators unique?
- They are easy to use. Just add them to the chart, and that's it. Every indicator comes with default settings that should work for most traders.
- They are easy to read. Each pattern is drawn with a different color and clearly labeled, so you don't have to wonder what kind of pattern is that.
- They check multiple points from the past. Most of the indicators that we have seen so far can only check the points that are next to each other. They will miss a lot of patterns that have been forming for a long time - and those patterns are often strong signals. Our indicators automatically check multiple historical points.
- They offer many customization options. If you don't like the default settings, you can change a lot of options there. Select which patterns you want to search for, increase or decrease the error margin, or display which points have been checked. You can even move the overlapping charts or labels and increase the line width to make the charts easier to read.
- We offer support to help you understand how they work and how to use them efficiently. Our articles and tutorials explain how to use each indicator and how to combine them for a better analysis. And if you have questions - we will answer them either via email or through the TradingView chat.
- Paid indicators come with a free trial and a 2-week money-back guarantee. If you are not happy with how they work, you get your money back.
- They detect all harmonic patterns: Gartley, Butterfly, Bat, Alternate Bat, Crab, Deep Crab, Cypher, and Shark.
And they can do much more than just drawing the existing patterns. The Harmonic Predictor predicts where a harmonic pattern might appear in the future. It's a great way to either increase your profits or prepare a trading strategy for when the pattern actually appears.
Our indicators
Here are the best TradingView indicators that we have created (or are currently working on).
You can find all our scripts on our TradingView profile.
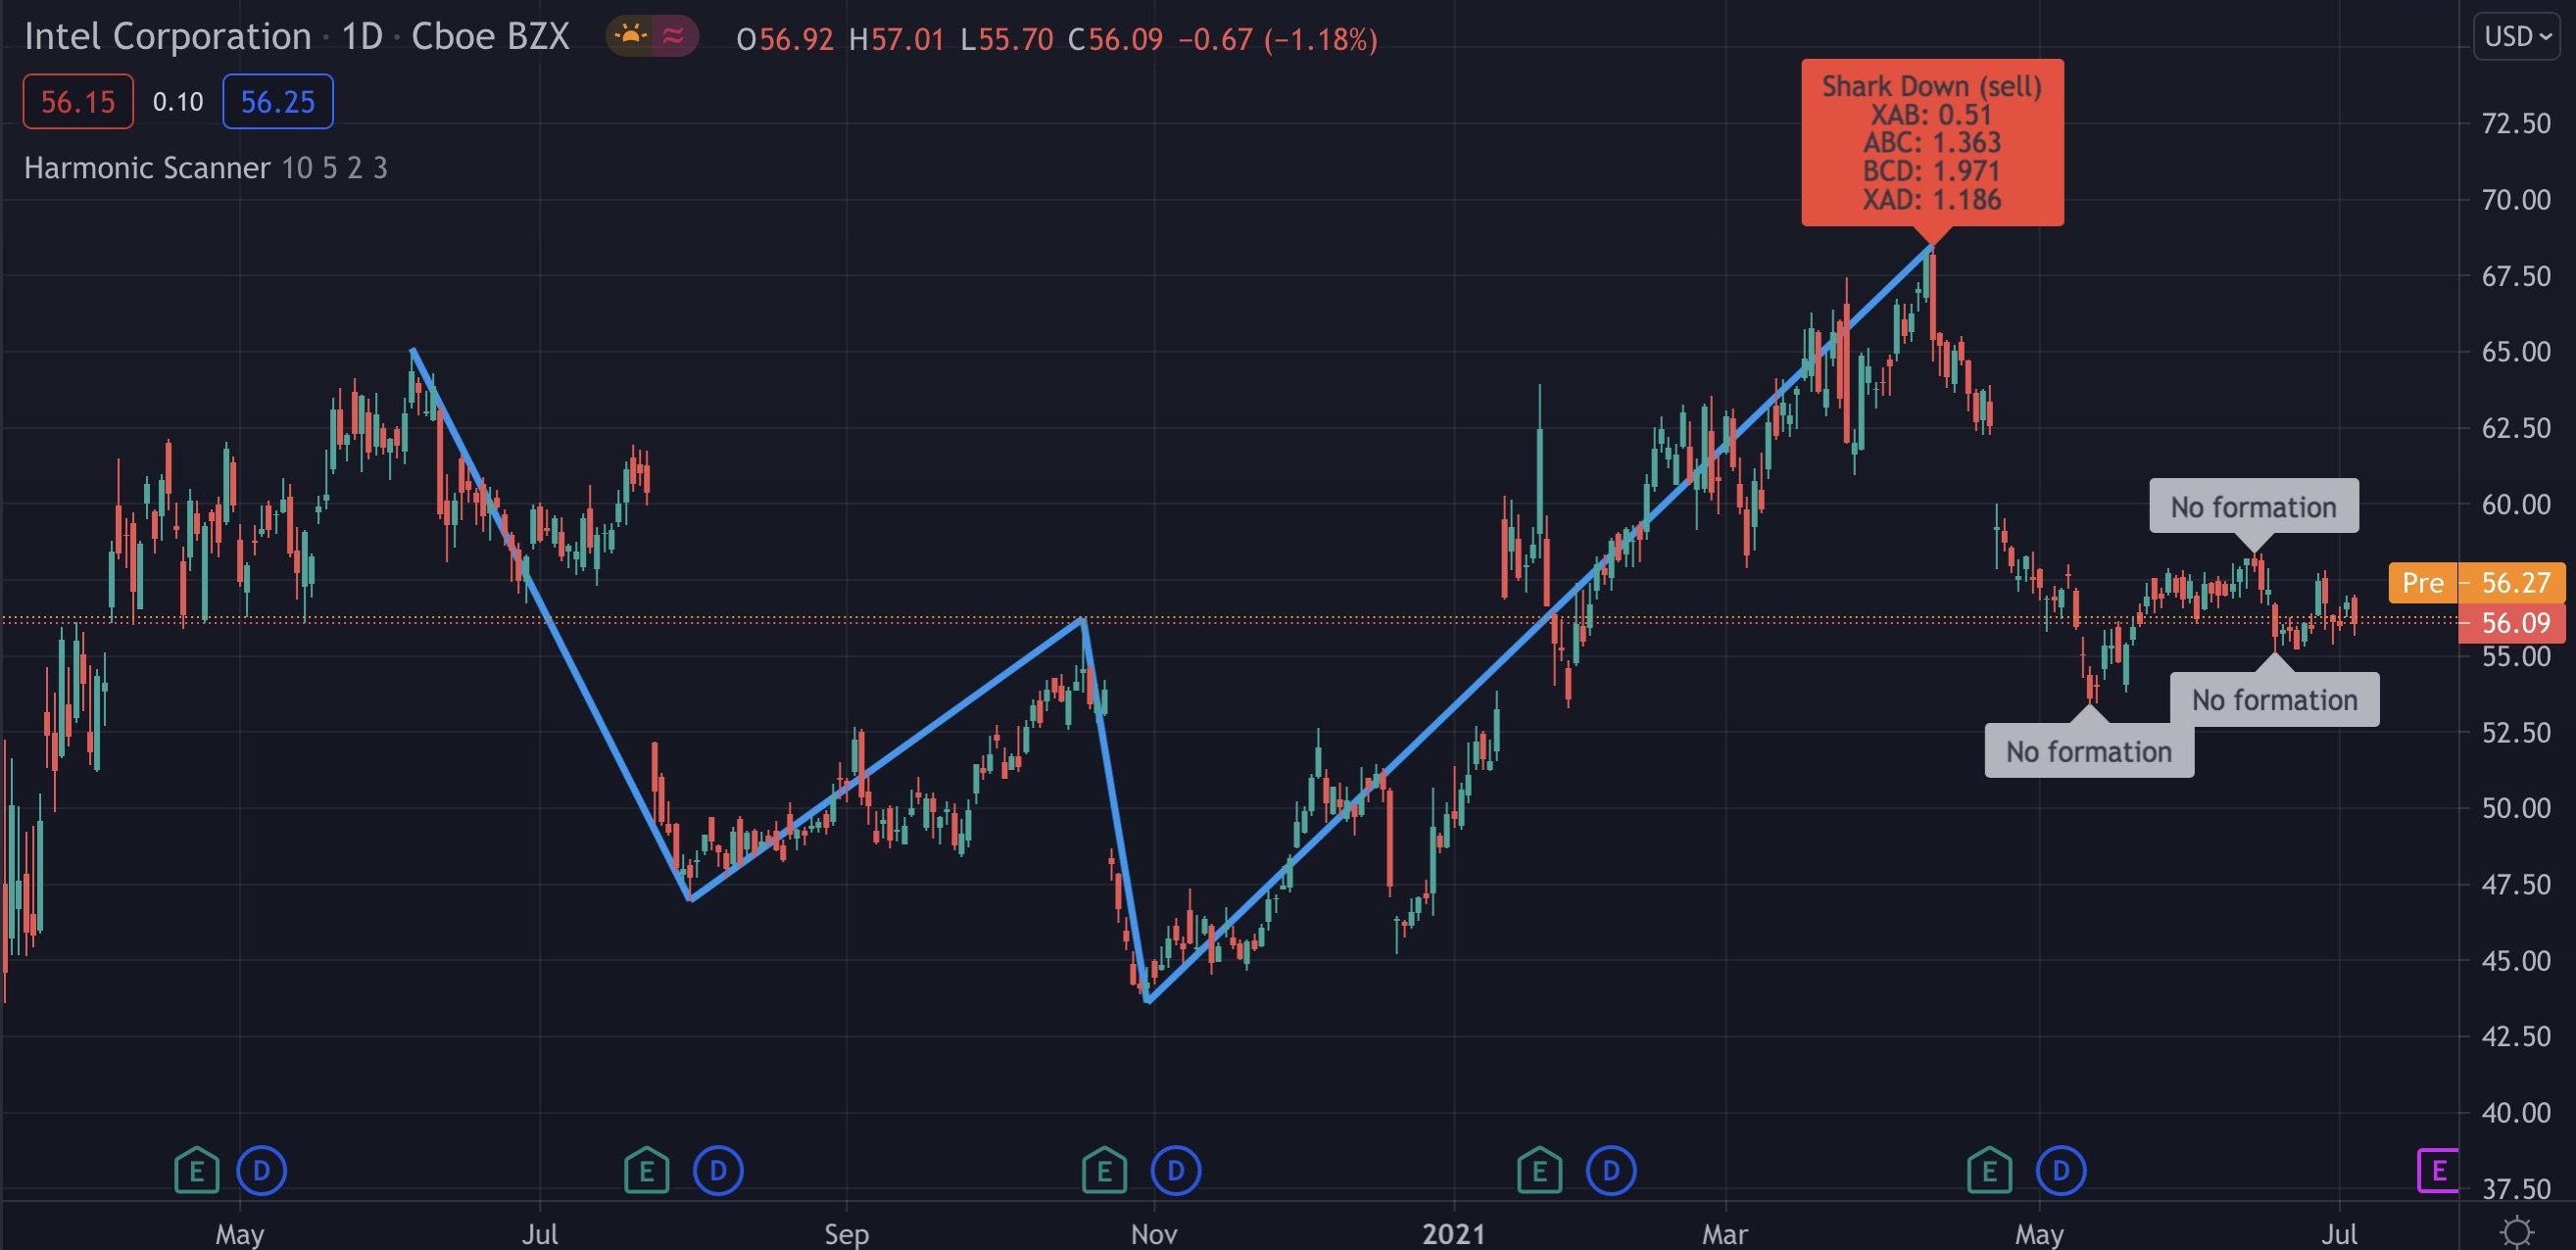
Harmonic Scanner
Our standard scanner for detecting harmonic patterns. It can spot the Gartley, Butterfly, Bat, Alternate Bat, Crab, Deep Crab, Shark, and Cypher formations. Not sure what all those animal names mean? Check this article from Investopedia.
Unlike other harmonic pattern indicators we have seen, this one doesn't analyze only the last consecutive high/low points. It looks back up to the previous 100 points in history, trying to find formations that started long ago but are still valid.
Features
- Adds a label with a formation name and a buy/sell signal.
- Marks the formation on the chart without adding unnecessary, confusing lines as other indicators do.
- Checks up to 5 last high/low points to determine if they end a harmonic pattern.
- Optionally can indicate what points were checked (even if no formation was found).
- Fully customizable. You can select the depth of search (how many high/low points to check), show the zigzag formation, hide the "No formation" labels, and more.
- Displays the retracement levels for each pattern leg (XAB, ABC, etc.)
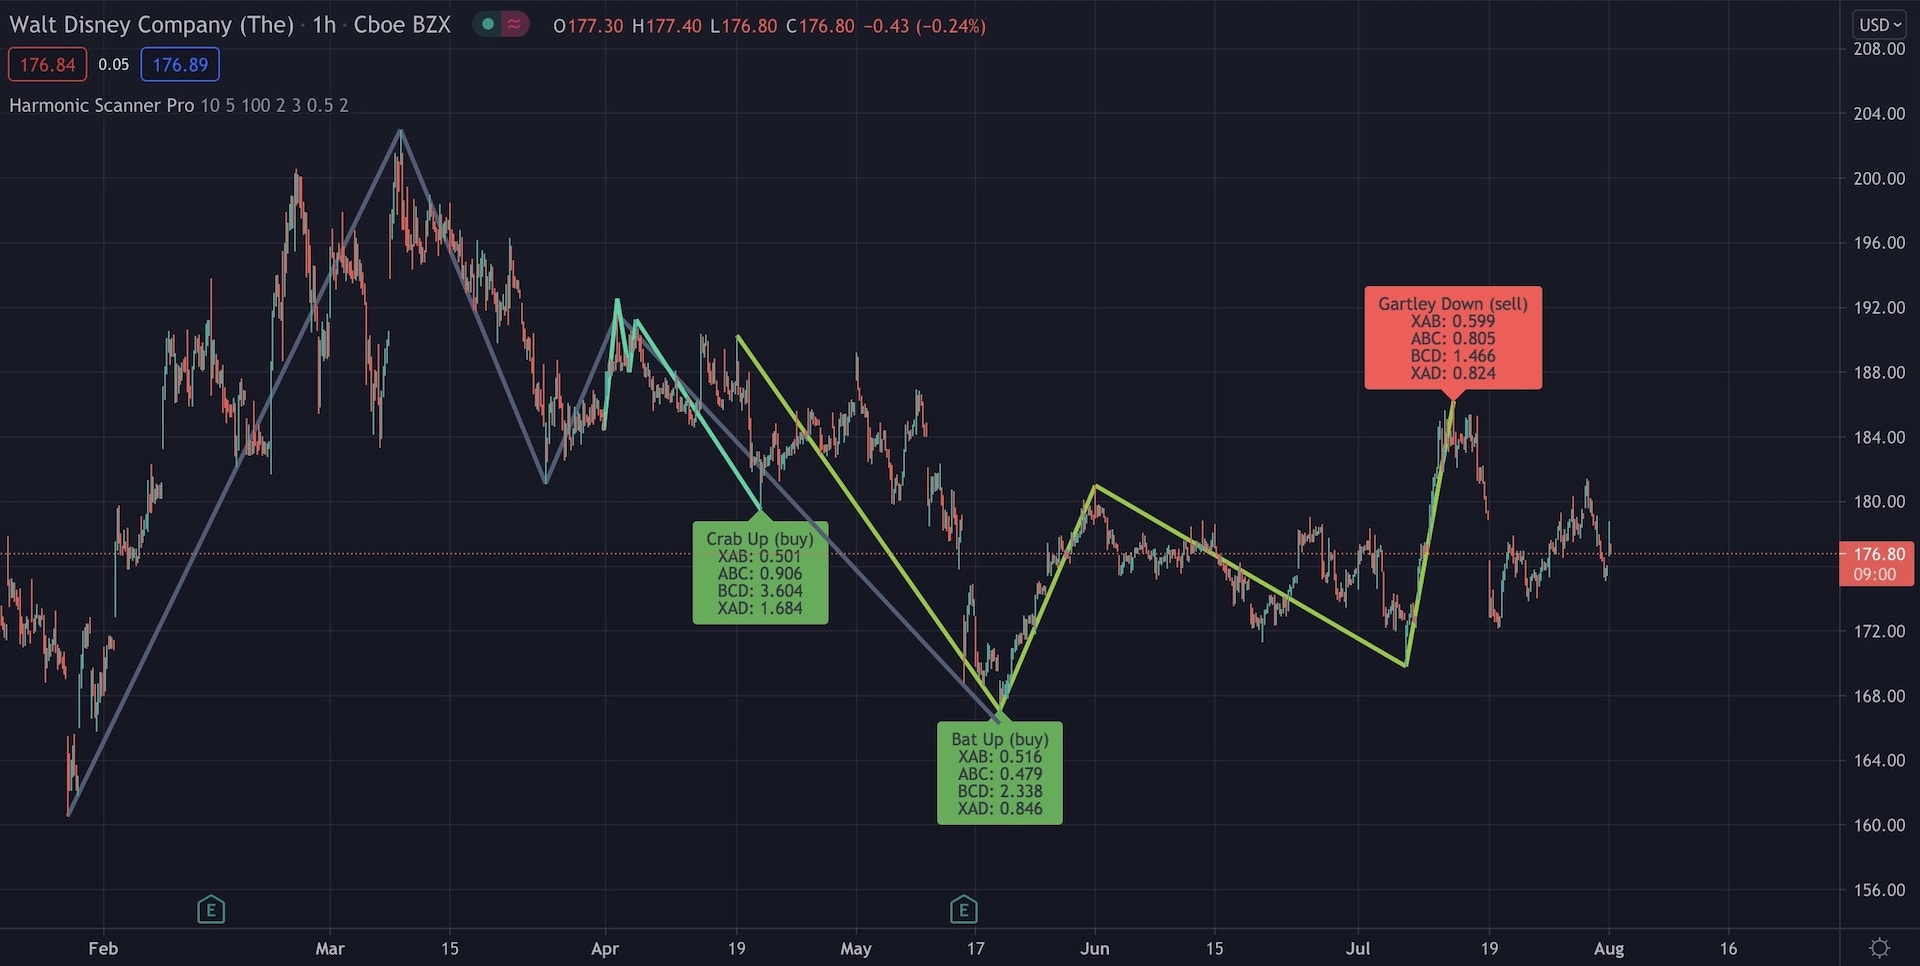
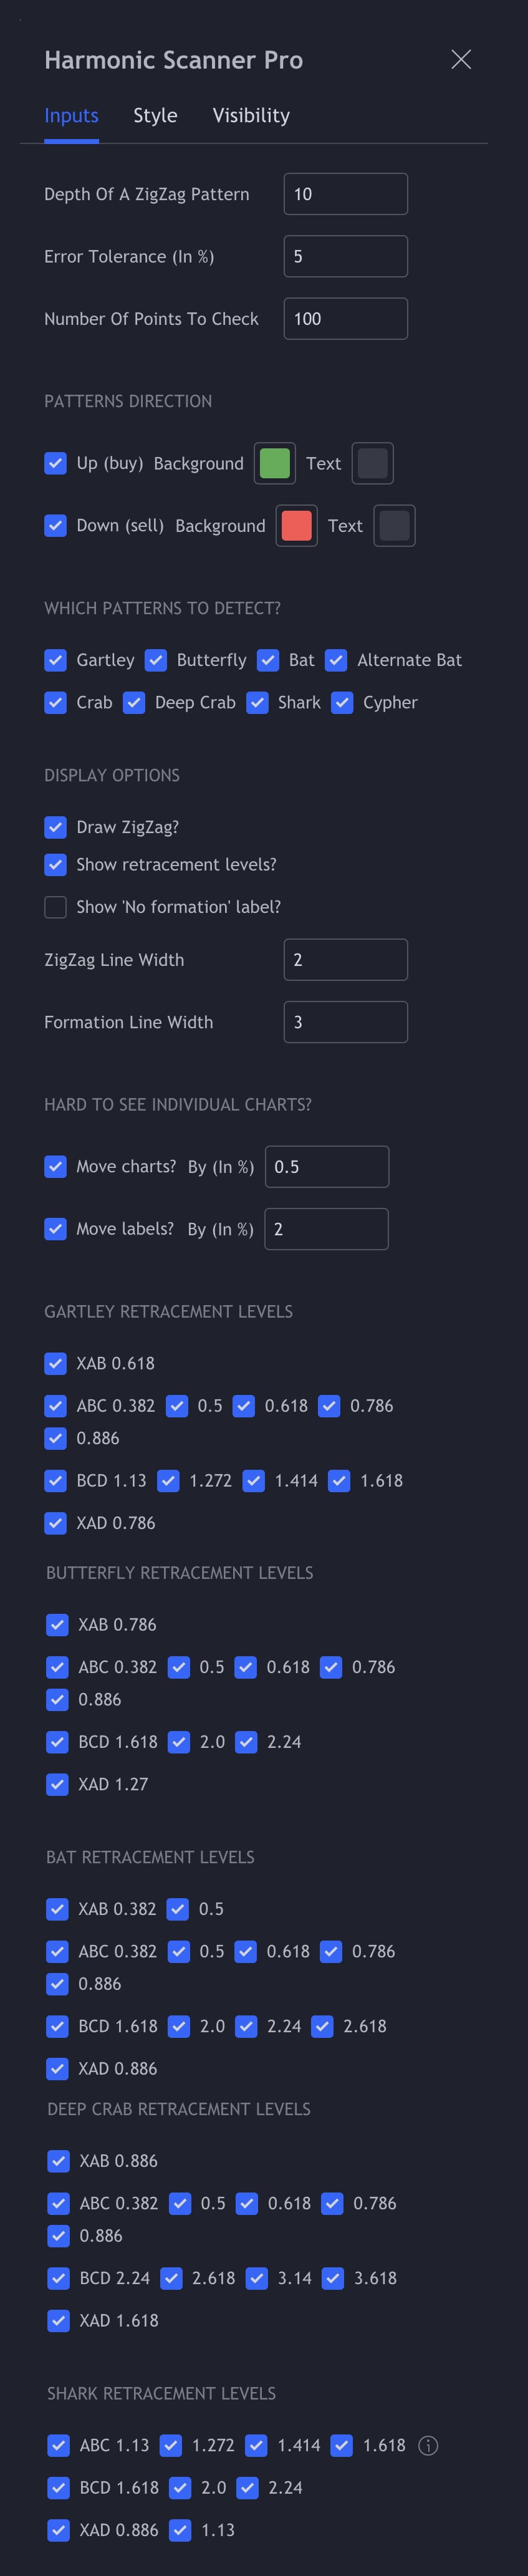
Harmonic Scanner Pro
This is a more advanced version of our standard Harmonic Scanner. While the Harmonic Scanner is a perfect tool for quickly detecting harmonic formations, Harmonic Scanner Pro is built for analyzing them and getting alerts when new ones appear. It lets you customize almost every parameter (even the retracement levels), check for harmonic patterns much further in the past, detect multiple patterns at once, and set up alerts for any new pattern. It's a great tool to see how specific security reacts to harmonic patterns (some stocks are a textbook example of harmonic patterns, others - not really).
Features
Everything from the "Harmonic Scanner", plus:- Can check an unlimited number of points (the free version checks only the last 10 points).
- Displays all the harmonic patterns that it can find (the free version displays only the first pattern found). Each pattern has a different color, so they are easy to see on the chart.
- Alerts. You can enable TradingView alerts and get a notification when a new pattern shows up.
- Enable/disable specific patterns. If you are only interested in a subset of all the harmonic patterns that we support, you can disable the rest of them.
See the video of how to use it, examples of some patterns that this script can find, and explanation of all the configuration options here.
It comes with a 2-week 100% money-back guarantee, you can cancel any time, and if you pay for a whole year, we offer a 25% discount!
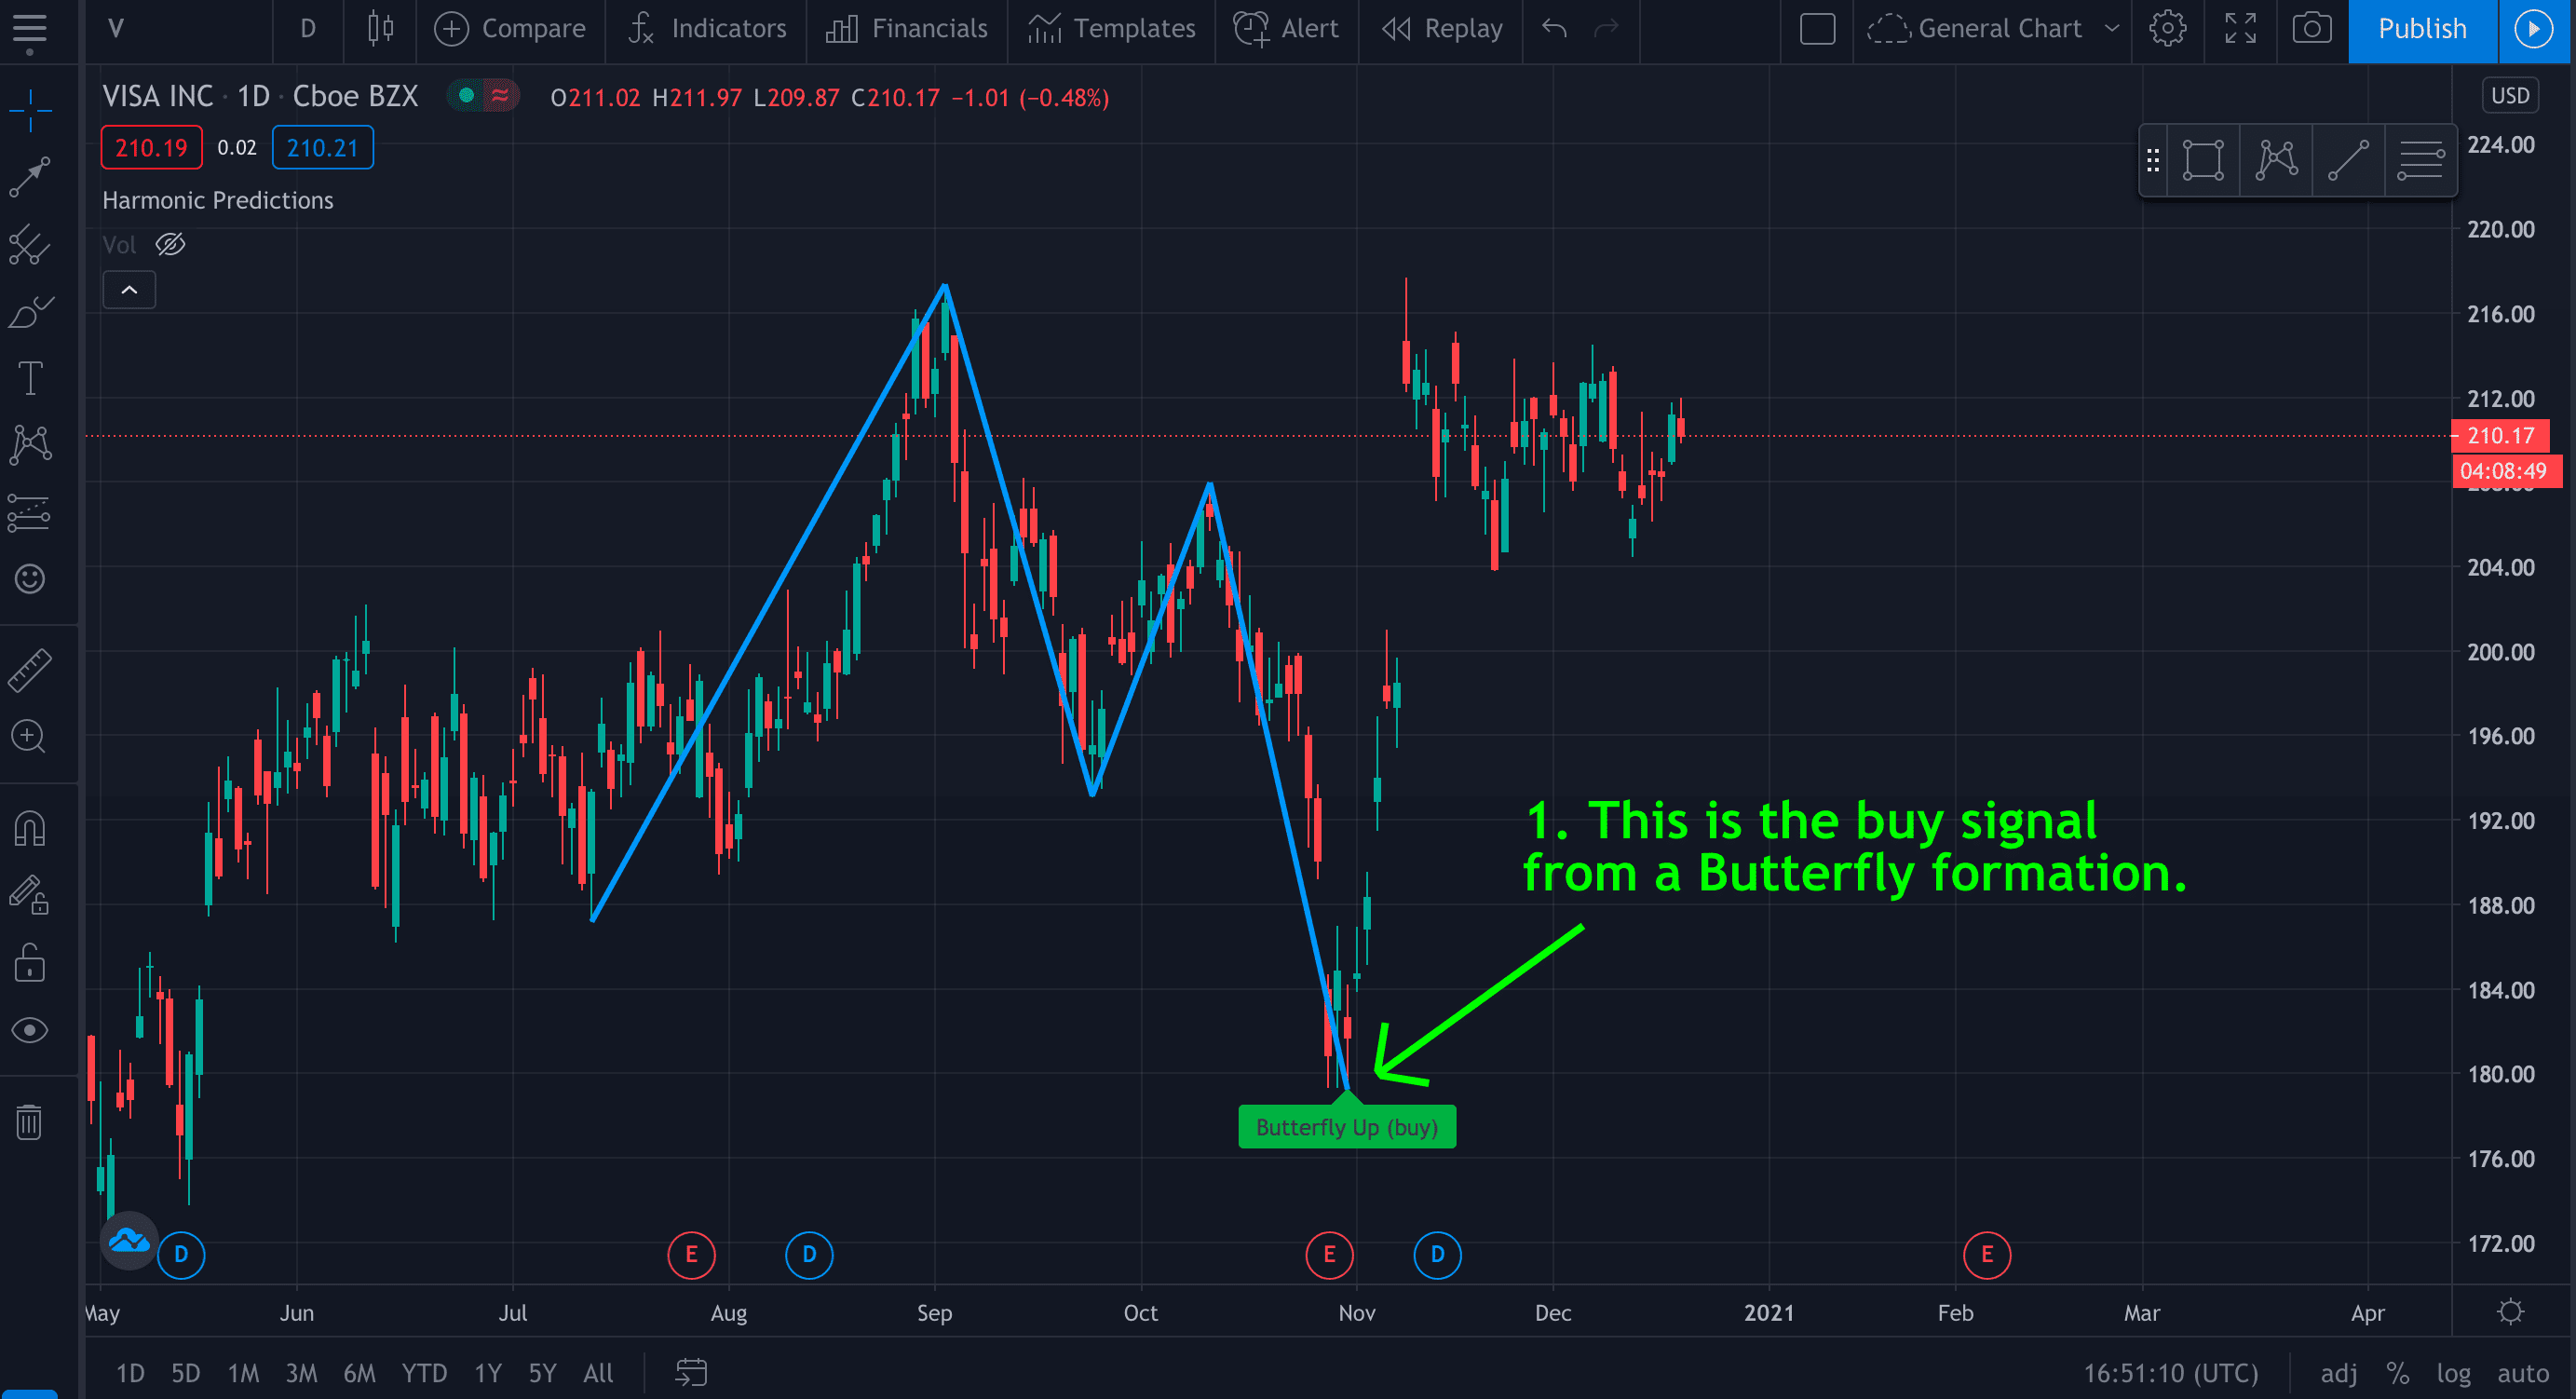
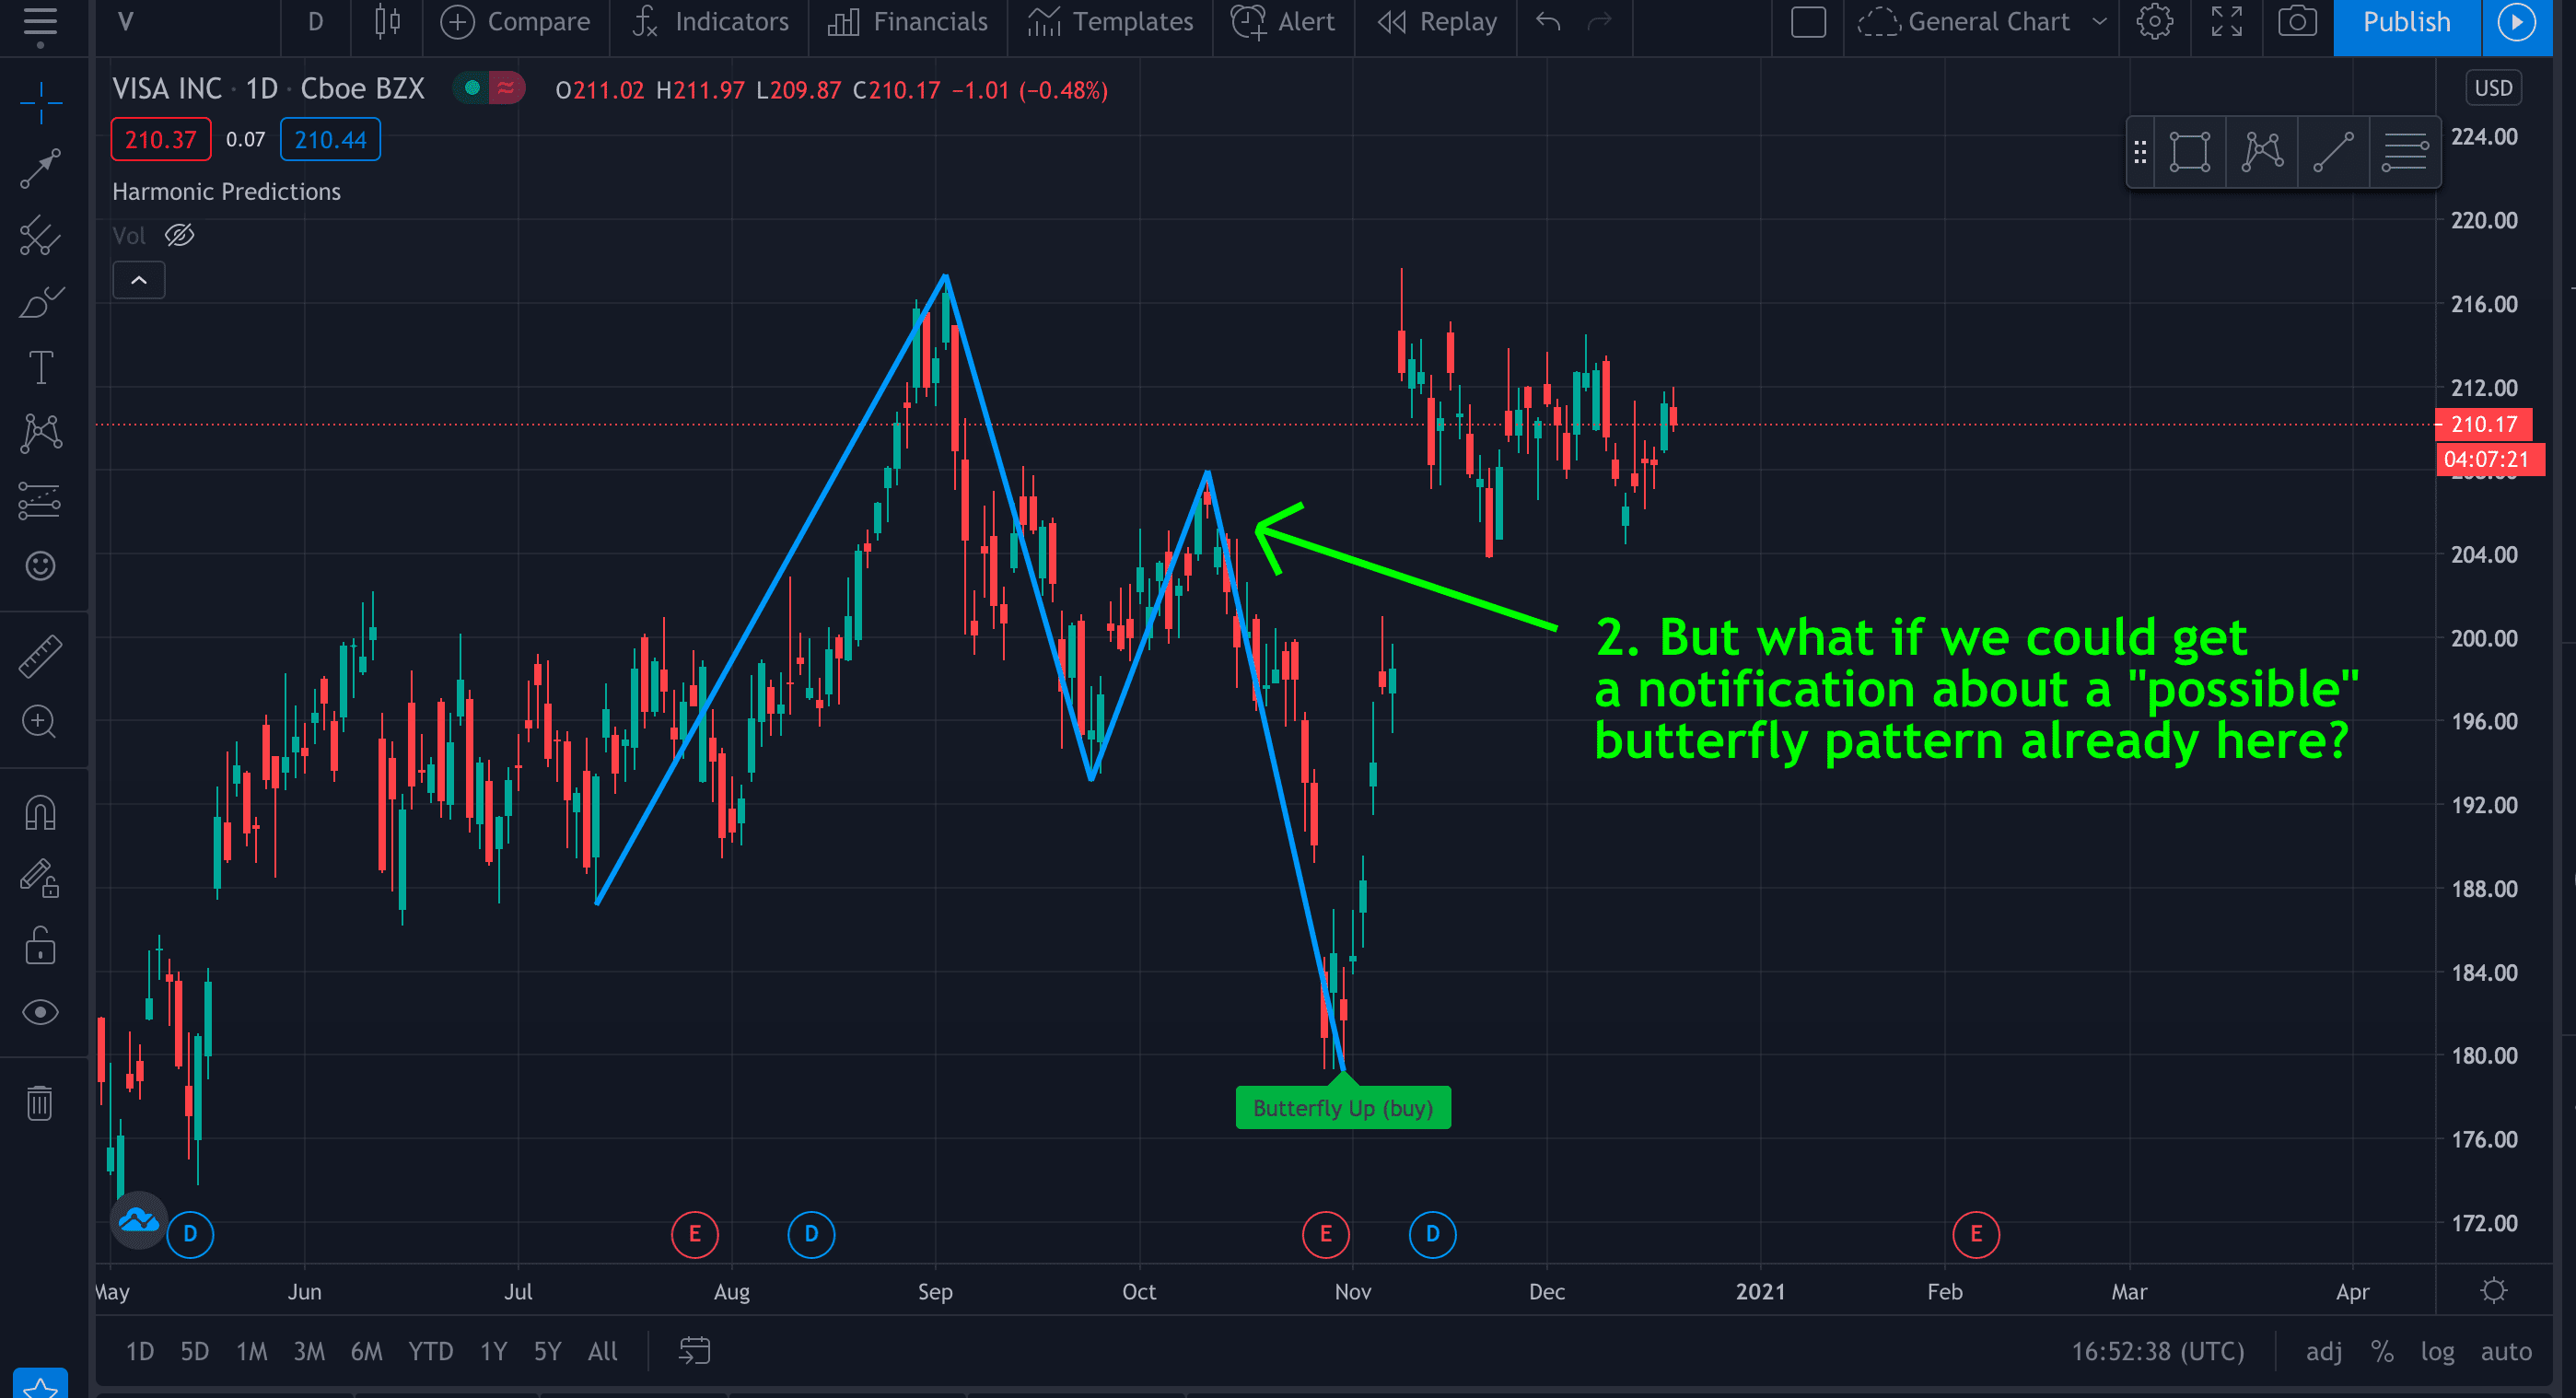
Harmonic Predictor
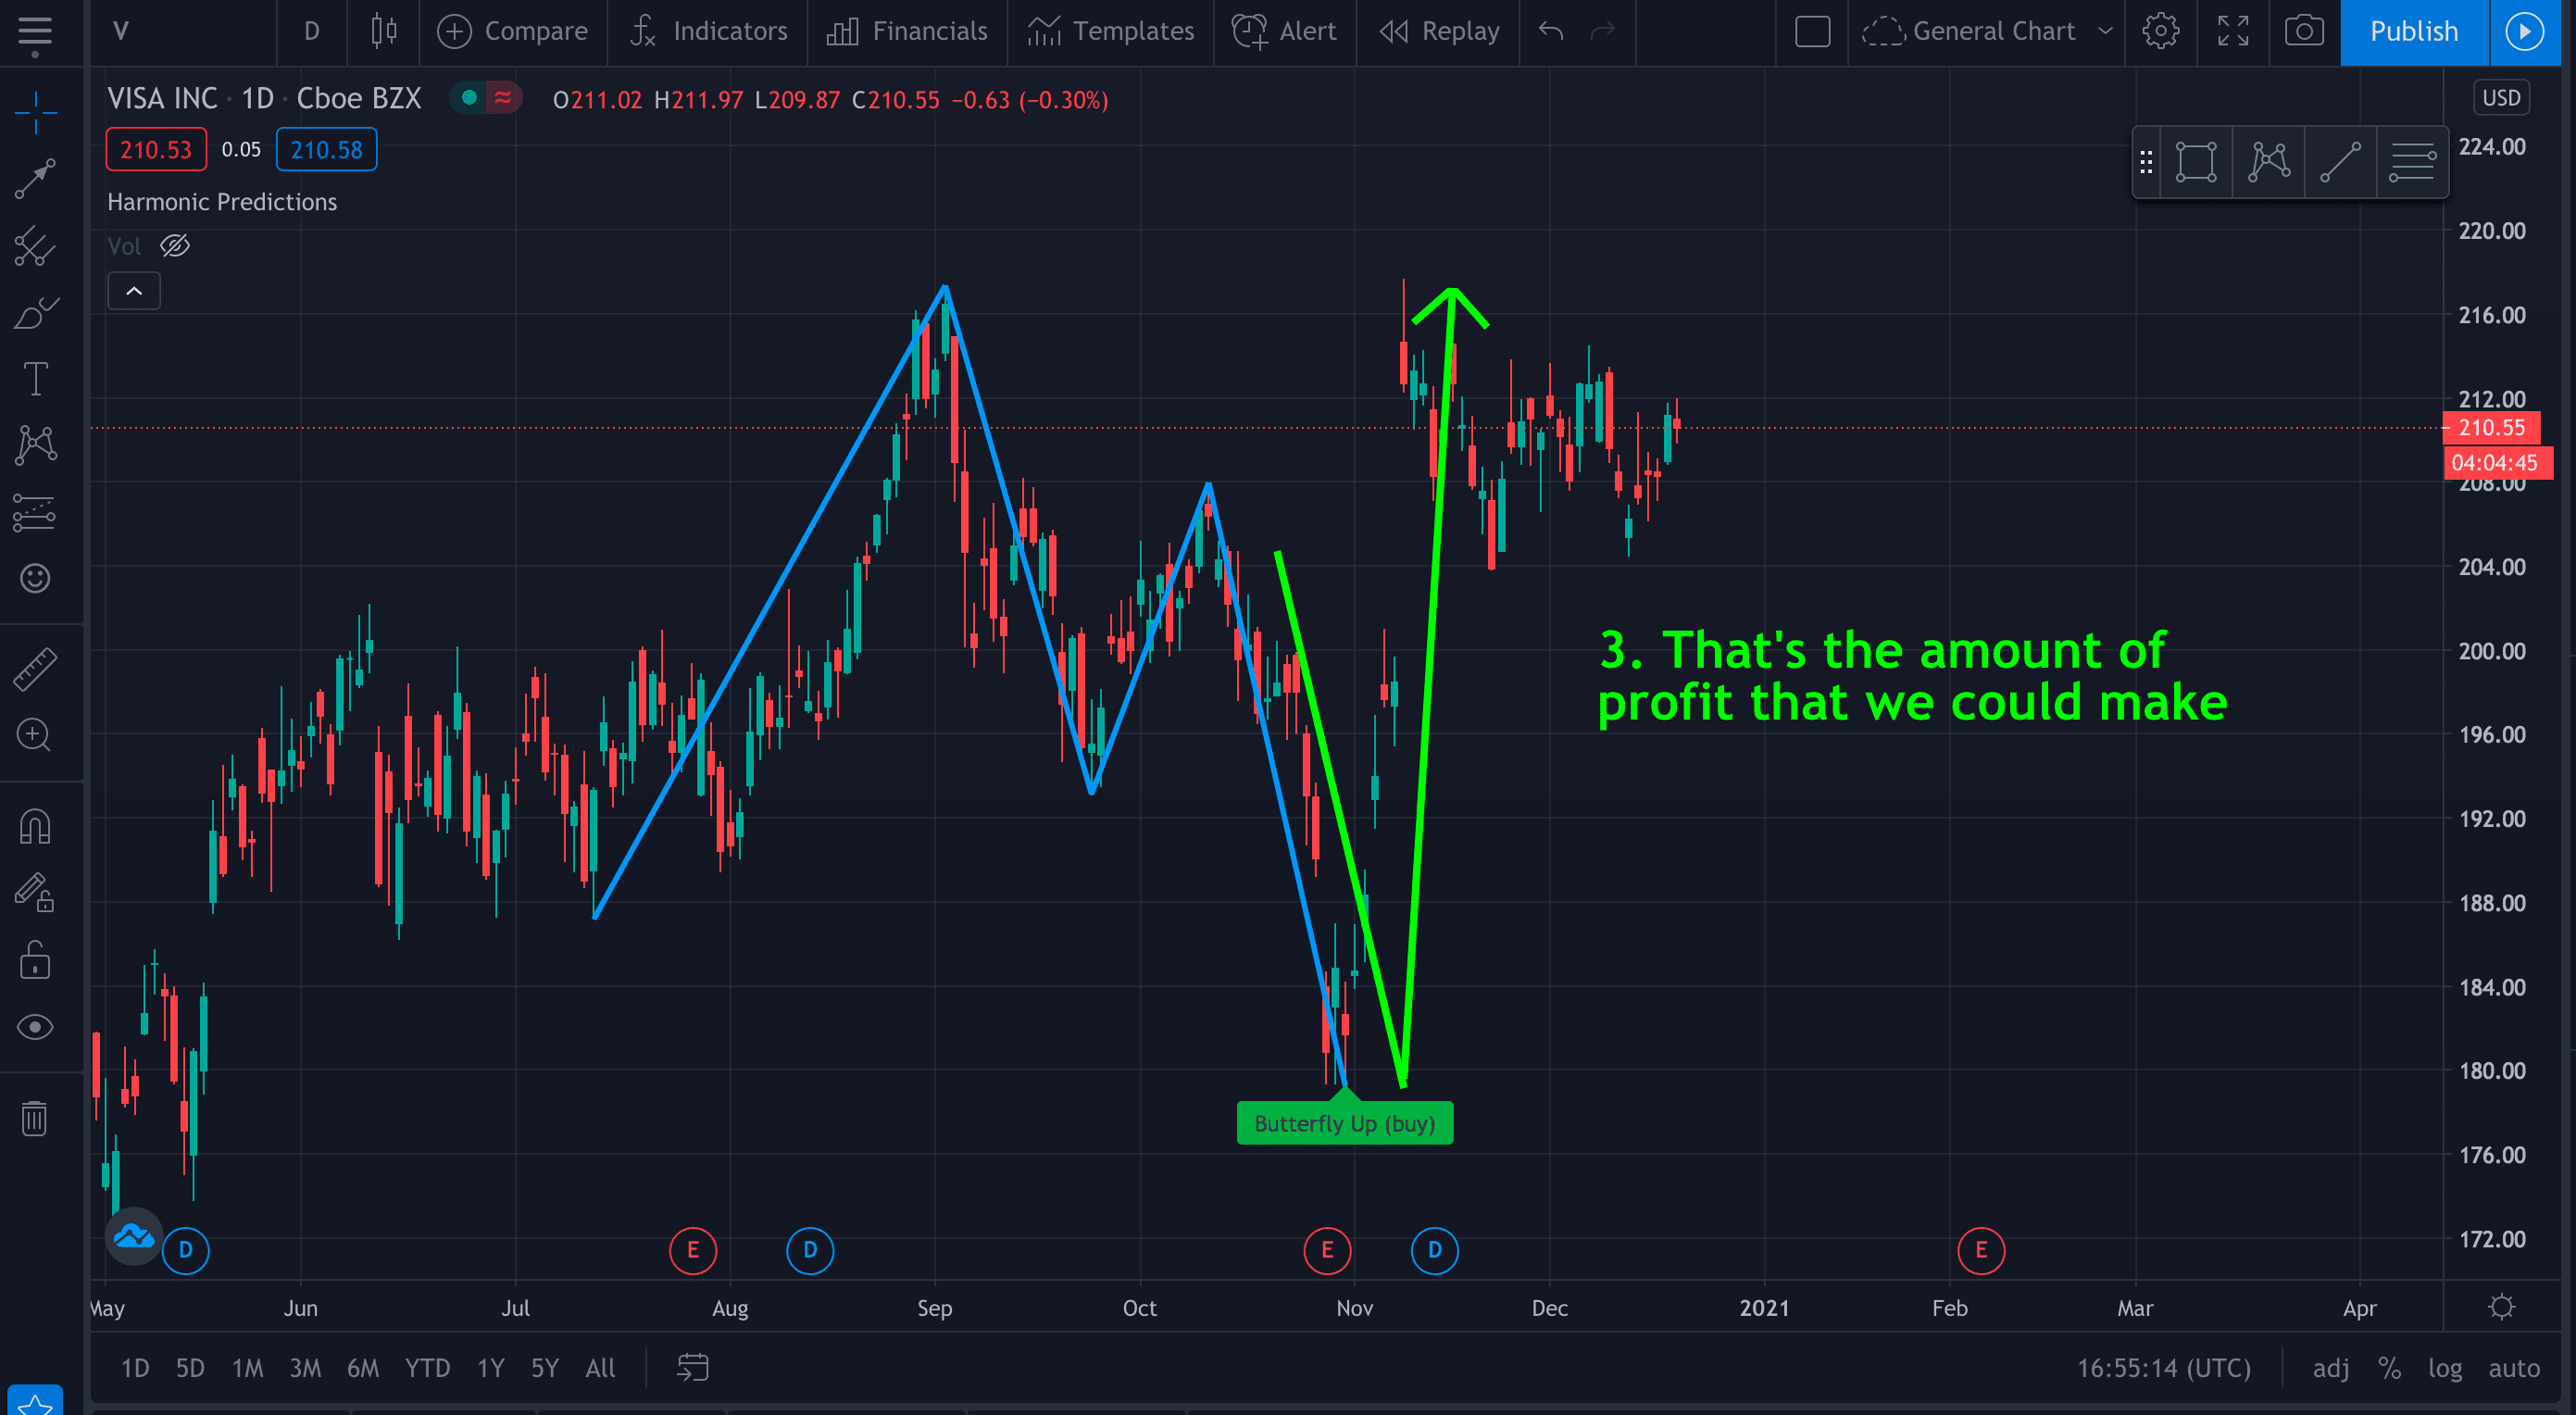
How about we try to predict a future harmonic pattern? Take points X, A, B, and C points and try to determine where point D might show up. That way, we can profit on the way from point C to D, and then we can reverse the position in point D and profit even more!
It's riskier than trading on fully-formed formations but more profitable.
Features
- Displays a possible scenario for a harmonic pattern.
- Shows the expected price for a formation.
- Displays multiple possible patterns.
- You can set alerts when a new formation is predicted.
- Detects the following patterns: Gartley, Butterfly, Bat, Alternate Bat, Crab, Deep Crab, Shark, and Cypher.
- Plenty of configuration options: disable specific patterns, change error tolerance, style and width of charts, move overlapping charts around, and more.
See the full list of features, examples of some patterns that this script can find, and explanation of all the configuration options here.
It comes with a 2-week 100% money-back guarantee, you can cancel any time, and if you pay for a whole year, we offer a 50% discount (yup, that's six months of access for free)!
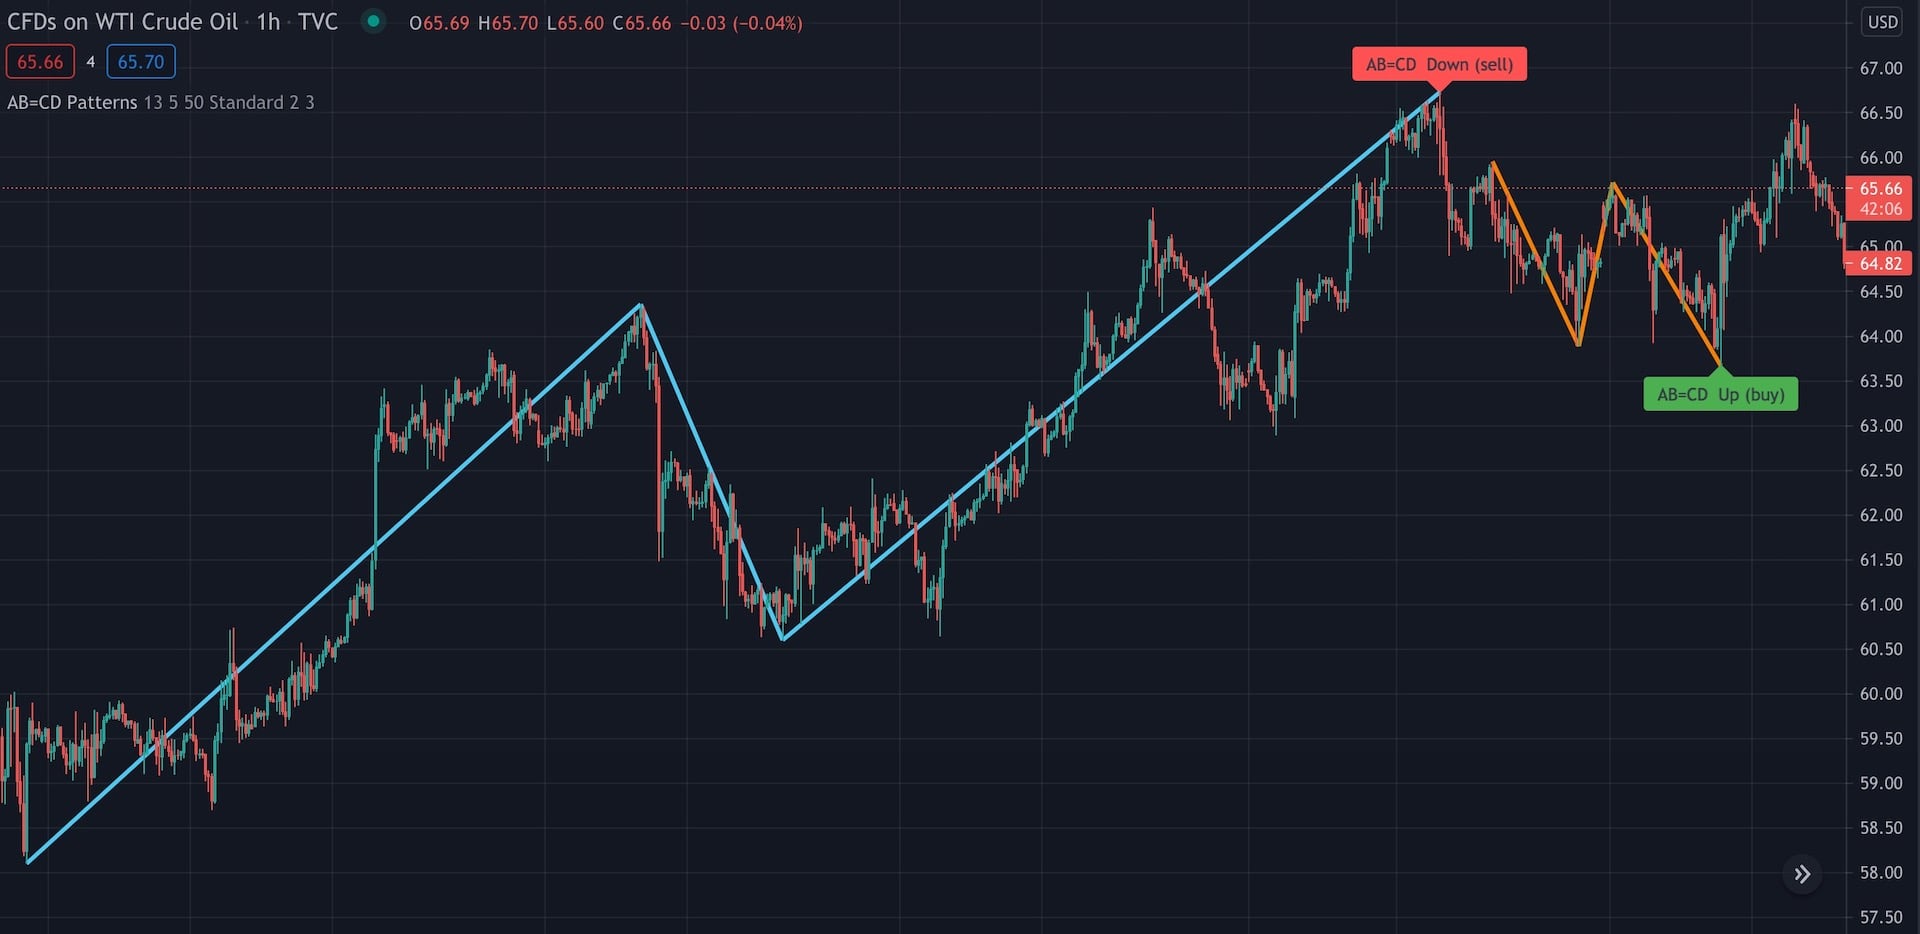
AB=CD Patterns
AB=CD is the simplest harmonic pattern that uses only four points (A, B, C, D) to determine the possible price reversal zone. This script can help you easily spot it on your charts for free.
Features
- Two ratio types to choose from: "Standard" and "Strict" (this one only checks 0.618 and 0.786 retracement levels for point C and 1.272 and 1.618 for point D)
- Checks multiple historical points. You can select how many you want to check in the options
- Configurable error margin, so you can define how strict the search should be
Trading ideas in your inbox
Join our newsletter to get notifications of new and updated indicators and new features that we launch. You can also follow us on the TradingView platform or on Twitter to get notifications about new trading ideas.