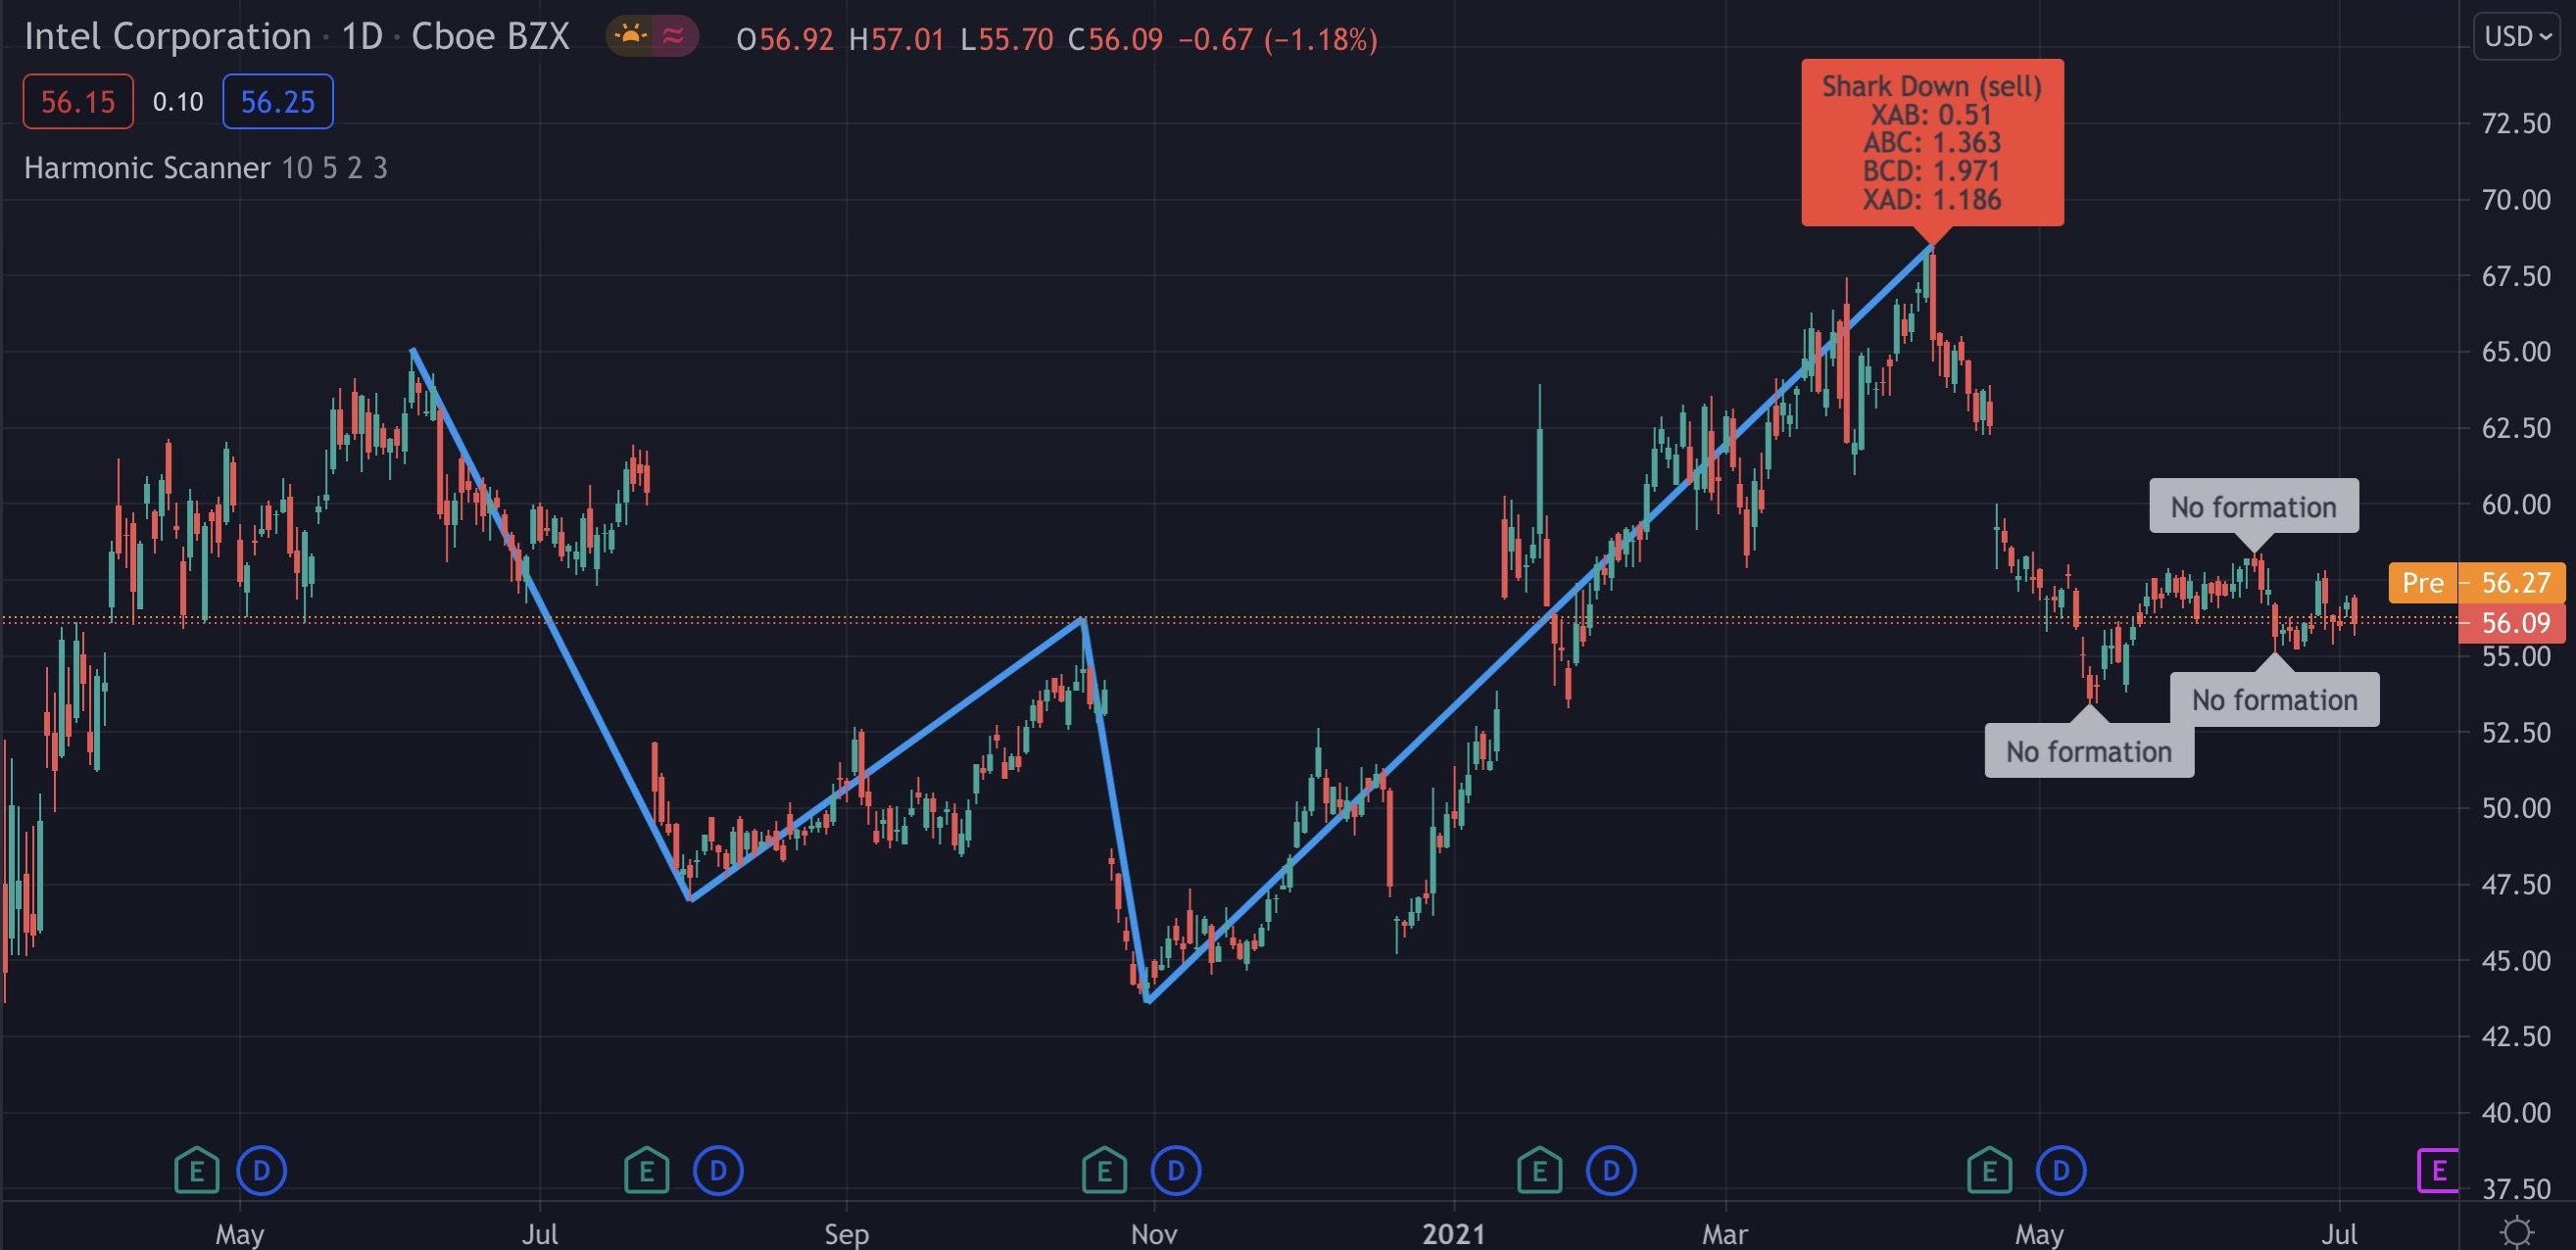
How to use it?
Here is a short video explaining how to add this indicator to your charts, configure it and scan any type of instrument on the TradingView platform:
Configuration
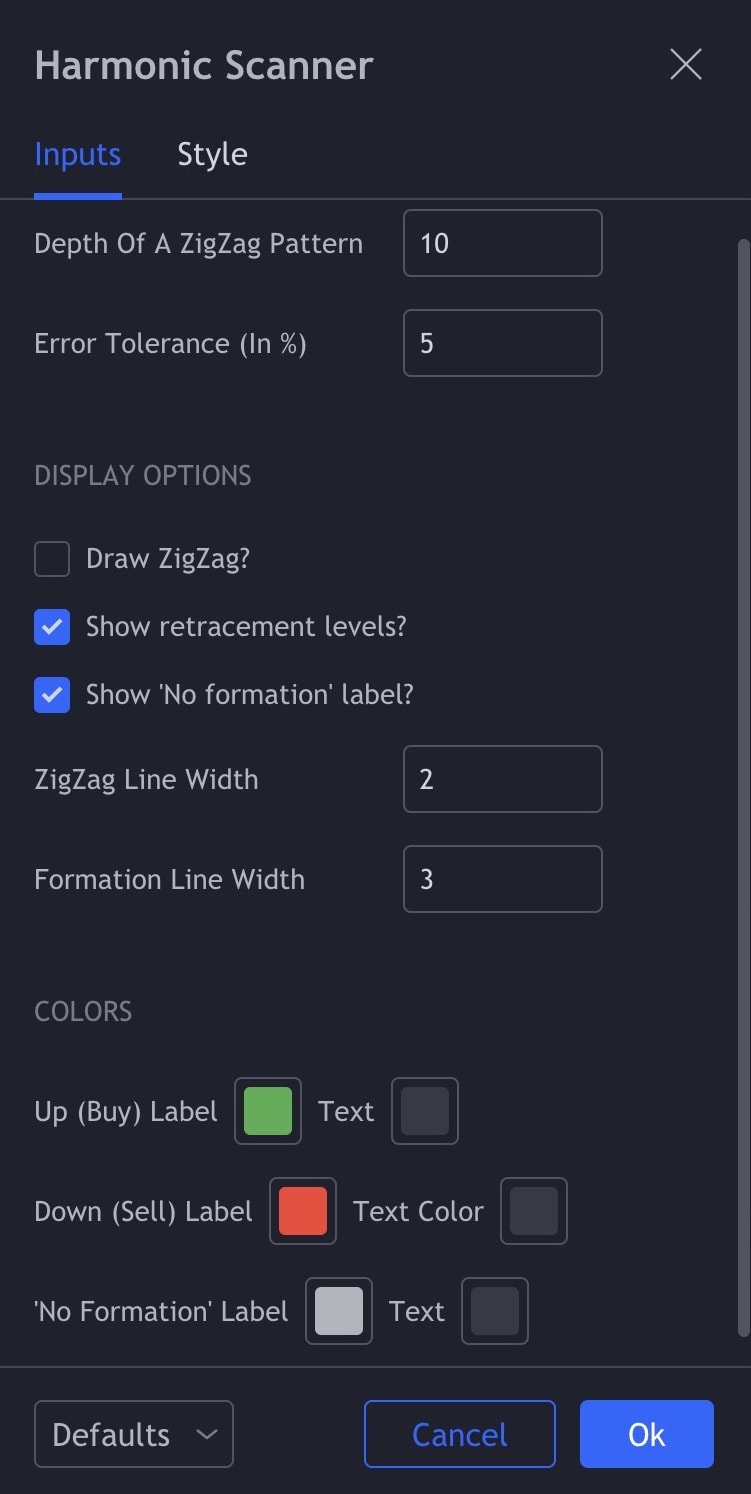
Harmonic Scanner comes with the following configuration options
Depth of a ZigZag Pattern
Defines how many previous candles to consider when checking for the high/low points. If you choose a high number, there will be fewer points to check, and the script will be faster. If you choose a low number, the script will be slower, but it will check more points. To see the high/low points on the chart, enable the "Draw ZigZag" option.
Error Tolerance (In %)
How much the detected pattern can differ from the "ideal" pattern. With a 5% error tolerance, if the "ideal" retracement is equal to 0.618, we accept a retracement between 0.5871 and 0.6489. Not sure what a retracement is? Check out the "What Are Harmonic Patterns?" article.
Draw ZigZag?
When enabled, it displays the zigzag pattern (line combining the high and low points). That's the zigzag that we check to find the harmonic patterns. This option is useful when you want to calibrate the depth of a zigzag.
Show retracement levels?
When enabled, it shows the retracement values for each pattern leg (XAB, ABC, etc.) in the label under the pattern name. Retracement values can also be displayed when you hover your mouse cursor over the label with the pattern name (no matter if the "Show retracement levels?" option is enabled or disable).
Show 'No formation' label?
Whether or not you want to display the 'No formation" labels.
ZigZag/Formation Line Width
Width of the lines on the chart - it's a purely cosmetic option. Decrease it if the lines obscure other drawings or increase it if they are not visible enough.
Up/Down/'No Formation' label and text colors
Change the color of the label (background) or text for the "Up," "Down," or "No formation" labels. It can be helpful if the default colors are hard to read.

